Metrics Dashboard
Last updated:
The metrics dashboard gives you a 30-day view of how Oscova is being used. It combines chat usage, model provider usage, tool activity, task runs, estimated cost, and audited egress events in one place.
Note
Metrics are usage counts recorded by the app. They help you spot workload, cost, reliability, and privacy patterns without opening every chat or task run.
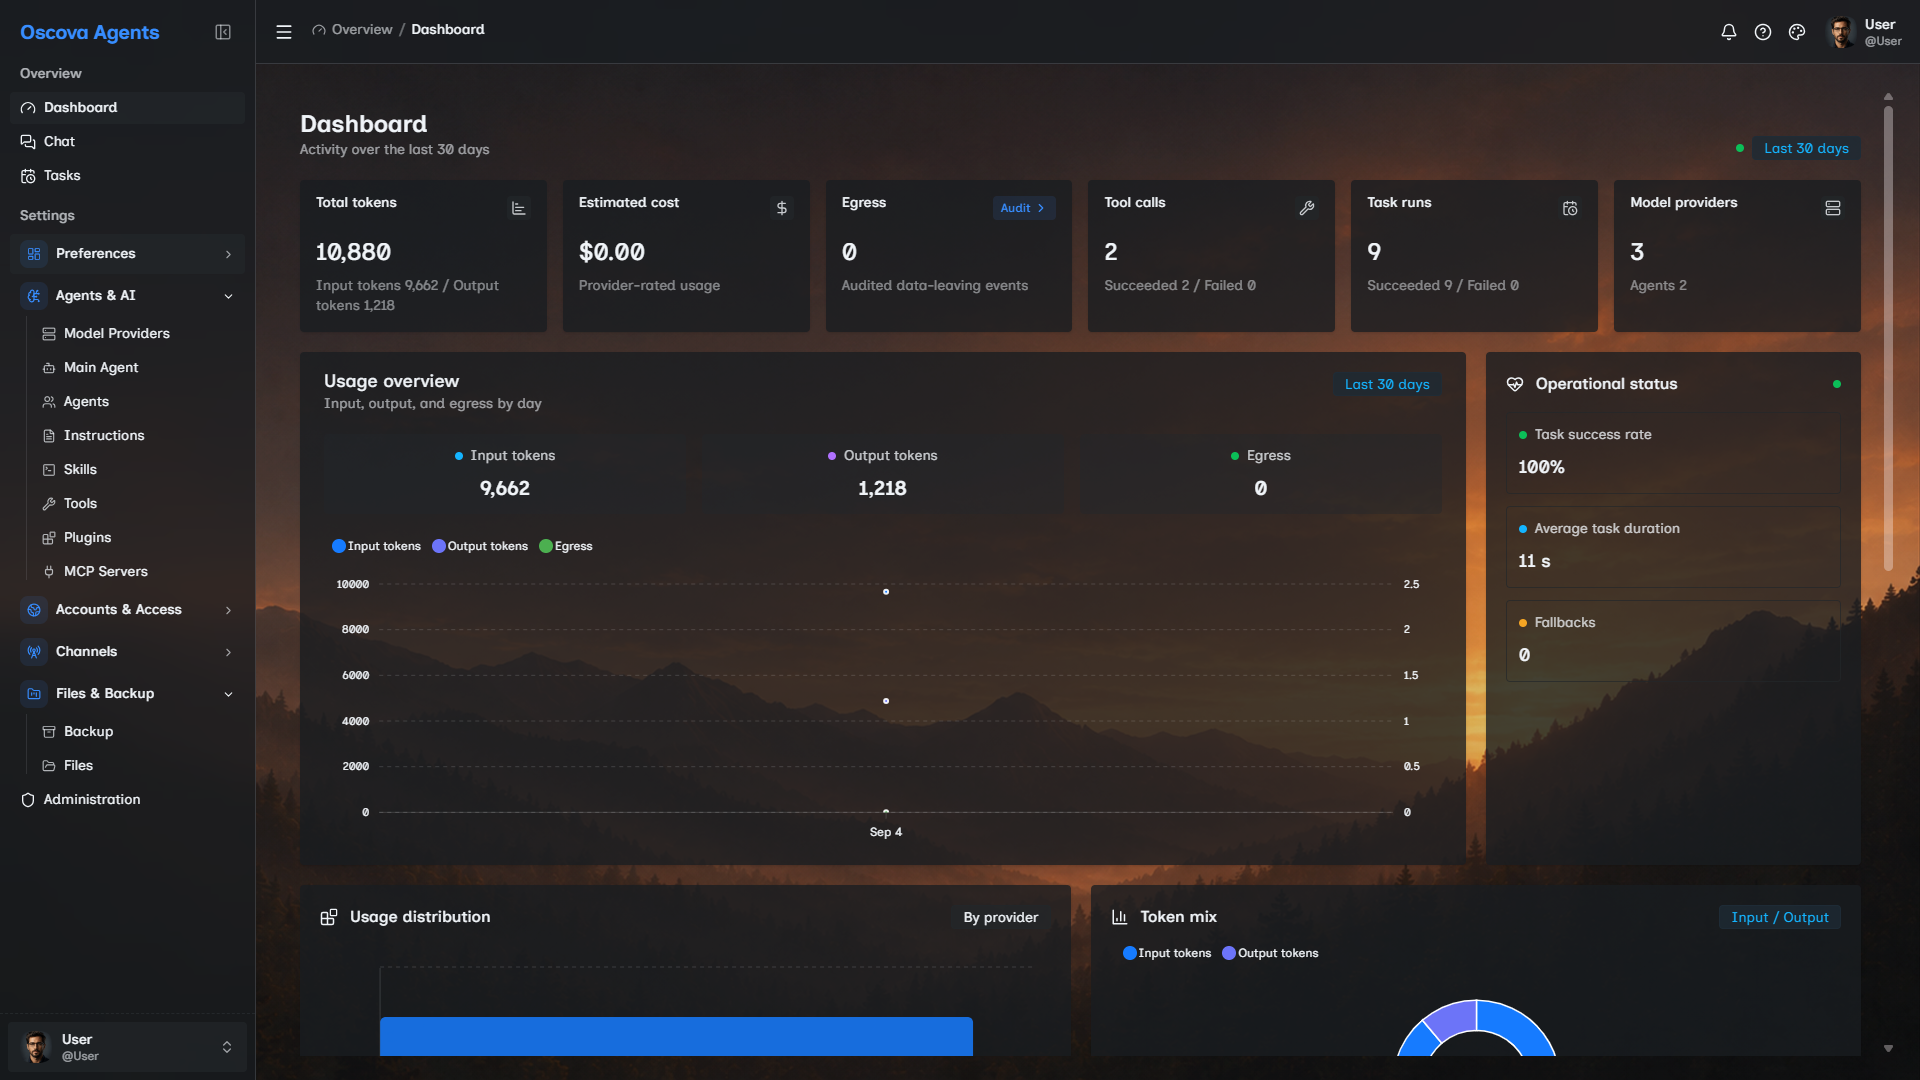
Open the dashboard
Open Dashboard from the main shell. The page header shows Activity over the last 30 days and a Last 30 days badge.
If there is no activity yet, the dashboard shows No metrics yet. Run a chat or an agent task, then return to the dashboard after the run finishes.
Oscova keeps dashboard reads fast by caching metrics snapshots. If you just completed a run and the dashboard still looks unchanged, refresh the page or wait for the background aggregation tick to update the cached view.
Read the summary cards
The top row shows the main activity totals:
- Total tokens: input and output token volume.
- Estimated cost: provider-rated usage based on the cost rate saved on each provider when usage is recorded.
- Egress: audited data-leaving events. Click this card to open the egress audit details.
- Tool calls: successful and failed tool invocations.
- Task runs: scheduled, manual, webhook, and chained task execution activity.
- Model providers: configured provider count, with the agent count beside it.
Note
A token is a small piece of text counted by a model. Input tokens come from prompts and context. Output tokens come from model responses.
Review the charts and panels
The Usage overview chart shows input tokens, output tokens, and egress by day. Use it to notice spikes, quiet days, and whether egress rises with a particular workload.
The Operational status panel shows task success rate, average task duration, and fallback activations.
Lower panels break usage down by:
- Provider, agent, and model token totals.
- Provider cost totals.
- Tool success and failure counts.
- Usage distribution and input/output token mix.
When many providers, agents, models, or tools exist, the dashboard shows the top rows and groups the remaining tail as Other.
Understand egress on the dashboard
Egress means data left this machine for a provider, internet tool, or cloud embedding model.
The dashboard egress count is not a token count. It is the number of audited egress events in the 30-day dashboard window.
Local-only model work does not add egress because no data left the machine. Local-only work can still contribute to other dashboard areas, such as token, tool, and task activity, when those metrics are recorded.
Tip
Click the Egress card when you need the concrete event list behind the count. The audit dialog shows destinations, source type, agent context, and related IDs.
Admin view
Regular users see their own activity.
Admins see a system-wide snapshot for the main cards and charts, plus Admin usage by user and Storage by user panels. The per-user panels help identify which account produced token and egress volume, how much app-data storage each user folder occupies, and how many files it contains.
When an admin opens the egress audit from the dashboard, the audit can show system-wide rows and includes a user column.
Troubleshooting
- No metrics yet: run a chat or agent task and wait for it to finish.
- Recent activity is missing: refresh the page or wait briefly for the cached dashboard snapshot to update.
- Estimated cost is lower than expected: check the cost rate saved on the model provider. Cost summaries use provider-rated usage.
- Egress is zero: the recent work may have used only local providers and local-only tools, or no audited egress events were recorded in the last 30 days.
- A tool failure appears in tool calls: open the related chat, task run, or application logs for the detailed error.
- The dashboard cannot load: refresh the page. If it still fails, check application logs for dashboard or metrics errors.